Friday, May 8, 2020

Fear of Missing Out (FOMO) in investing

What is Fear of Missing Out (FOMO)? 

I came across this FOMO term these few days when we are discussing on the current stock market. Will it be one way ticket (uptrend) or will be the final push before coming down again?
FOMO is the apprehension which makes us believe that others might have rewarding experiences which we are missing out on.

I share on the two articles on Maybank and Tenaga with one of my friend. Since then he queued Maybank price at RM7.30 for almost 3 weeks but still not successful buying it. As for Tenaga, he queued for RM12.00 also not done till now. So he called me up and complaints that is he going to miss the boat? After few minutes of discussion, he decided to change the buying price for Maybank to RM7.35. He got it on the next few days and he was so happy that able to own a portion of Malaysia biggest bank now.

Above sharing is the typical symptom of FOMO in investing. To be frank, I’m a long time investor but still struggle with FOMO and need to deal with it.

How to Avoid FOMO When Investing

There are few of the advice in order to avoid FOMO when investing.

1) Start With the Goal in Mind

For any investment, you must start with end in mind. For example, what do you want to achieve in mid-term and long term. Each of the stock will have different return. Once buy in the stock, it must be monitored for a long time. From there to understand what is the correct decision to hold or sell according to the business performance.
There should not be an all time winner in the market. You only can make the minimum mistake in the market. Warren Buffet also making a wrong buying call in Airlines company in March 2020, but make quick decision to sell 100% of his airline share in May 2020
Up till here, the morale of the story is we must do our own homework thoroughly and that is the only way to reduce the mistake in investing.

2) Create a financial plan and stick to it

Think about the short-and long-term financial goals you want to achieve, your time horizon and your tolerance for risk. Create a financial plan that will help you achieve those goals, and then follow it. Just like my friend story when buying into a share, purchased price already decided but because of FOMO, plan changed after reconfirm on his investment objectives. On the other hand, he also understood the probabilities of the price getting higher or lower? What proportion will end? If those probability on the down side can be accepted, then will just execute.

Final word

Let's avoid FOMO, but Start Investing. Ultimately, we not be able to build a time machine to take us back in time to purchase the stock that got away that would've made you millions. But you can take steps in the present to help reach your long-term goals.

Invest in a way that makes sense for you and your goals and avoid FOMO.


“The Stock Market is designed to transfer money from the Active to the Patient.”
-Warren Buffett

Thursday, May 7, 2020

Leveraging on Share Margin Financing

Share Margin Financing (SMF) isn’t a term you’d hear on a daily basis. This facility can, however, improve your financial standing when used correctly.

SMF is a type of revolving credit facility that’s provided to investors, allowing them to finance their share trading and investment activities. With it, one can buy shares on borrowed money, secured by one’s collateral of choice. I myself started using this facility since Oct 2013.

Why do I used this Share Margin Financing (SMF)?

The main purpose for me to use this SMF facility is to maximize my investment return. I wish to used Other People Money to generate more return, which is called leverage. In the past, we know that only property can used OPM for leverage. In the recent year, SMF become more and more viable.

For example, if I would like to earn a passive income through dividen income from share, I have to used my own cash. If I have RM20,000 and invest into a stock with 6% dividen yield, my yearly Dividen will be RM20,000 x 6% = RM 1,200.
That means I will be receiving averagely RM100 per month.

If I able to used margin account with another RM20,000, that means I will have total of RM40,000 to generate my 6% dividen which will translate into RM2,400 per year. Isn't it great? Of course there will be interest rate cost that will be discussed in the later part of the article.

For this facility, we will requires to deposit either cash of share to the account in order to have the Margin Multiple.

Example of Margin multiple is as follows:
There is a multiplier on the value of the pledged collateral which defines the maximum amount of financing available.
E.g.: A bank provides 2.5x financing for pledged FD.
So by pledging a FD of RM20,000 you would get:
Available trading limit = RM20,000 x 2.5 = RM50,000

Interest Rate:

Interest is computed on a daily rest basis based on the end-day balance of the account. This daily interest is accumulated and is due and debited into the client's account at the end of the calendar month. If you are not using any of the amount, there will be no interest charged.

What will be the Risk?

The key risks associated with Margin Financing include the following. It is important to note that the list of risks is not exhaustive. An investor trading on margin can lose more than the initial capital.

a) Increasing interest rate

Interest Cost on margin loan might erode the gains made on Margined Securities. In a rising interest rate environment, the interest rate on the margin loans will head higher, adding to the interest load for the investors engage in margin trading.

b) Market crash causing margin call

When the share market crash, that means your share price is dropping and your initial share value collateral value will decrease as well. You probably need to top up cash during market crash in order to avoid force sell.

What will be my Strategy to use this SMF?

As mentioned, I have SMF since 2013 and below is the result for the share investing. I only used the margin to buy those companies that are paying dividen yields. With the dividen that pay out, I will be able to pay for the cost of borrowing as well. Below is the overall result that you can see how to utilize the SMF to maximize your return.

Conclusion:

Since Share Margin Financing can increases your purchasing power and allows you to use someone else's money to increase financial leverage. Margin trading confers a higher profit potential than traditional trading but also greater risks. Do consult with your financial advisor before engaging to this facility.

Wednesday, May 6, 2020

Why do people get poor?

I come across this question from one of the live webinar, the question throw to the audience. I saw the chat response as below:

lack of money, not born rich, not striking Jackpot, was born in poor family, parent not rich and many more.....

Now there is a phenomenon in society, that is the disparity between the rich and the poor
The rich are getting richer and the poor are getting poorer. I realised that me myself also having the poor mindset even today. For example, I washed my own car rather than send the car to wash by others, I cut my own garden grass instead of paying others to help to cut the grass. The reason is due to the COVIT-19, I can do it by my own. But one never think that the value of time is different. If my value of time of 1 hour of washing car is same as RM10 for others to clean for me, why not I spend 1 hour to think of how to create or study something that can create passive income for me in the future.

Refer to below a meaningful picture that compare the mindset of the Poor Vs Rich.
Source from Pinterest
What made a big change in my thinking?
I still remember that I bought Rich Dad Poor Dad book from Singapore in 2004. However, I did not read that book until year 2010 later. That book open my whole perspective on our real life and my own mindset about money management. From there onwards, I bought some other books author by Robert Kiyosaki. Over the years, below are some of the book I read.
Observed that the 1 book is missing from my collection, which is Rich Dad Poor Dad. I forgot lend to who to inspire him and wish that the person holding if have a change in life since then.

Do You Have a Rich Mindset? Or a Poor Mindset? Evaluate honestly yourself.

Monday, May 4, 2020

The most important money lesson learnt

In my past 12 years schooling time, there is no single lesson taught on money. Even the 7 years in Polytechnic and University, it was not taught as well. So end up , I spending about 19 years in education, missed the most important lesson which is about Money.

I only learnt this lesson at the age of 35. After spending 13 years in the corporate world. 13 years covering 3 big organizations, and there is no one know well about this Money lessons. It seem that our educational system has failed.

In our normal education, we were taught that in order to earn a Salary, we have to use our energy and time in order to convert it to our paycheck. The formulae is as follow:

Pay check = Hourly Rate x Time

For example, go to the Mc Donald restaurant to become a waiter/waitress, the hourly rate is RM4 and work for 10 hours a day, you will get RM4 x 10 = RM40 a day.

If you work for a month for 30 days, monthly pay check will be RM40 x 30 = RM1200

This formulae is well understood by everyone as our parent explains this to us. Thus, I conclude myself that Time = Money. In our Chinese verb also said that Time is precious and it cost money, once it gone, it will never return ~ “一寸光阴一寸金,寸金难买寸光阴”

Re-study the formulae again, Pay check = Hourly Rate x Time, basically there are TWO factors limiting your earning which is hourly rate and time. We all know that TIME is the limited commodity in the world. THe amount of time we have in any corners of the world will be the same for everyone. No one has more time or no one will have less time.

As for hourly rate, it is direct correlate with the skill you have in order to generate the value to the business. If you are looking towards to make more money, you have three choices.

Choice 1:
You have to work for more hours so that you can increased your paycheck. In other words, I have to worked over time say every day 16 hours a day. My pay check will be RM4 x 16 = RM64/day.
For this choice, we have to sacrifice our night time or weekend in order to earn more money. 

Choice 2:
Is to upgrade your skills in order to increase the hourly rate. For example, after finishing secondary school, you can work at Mc Donald for RM4 per hour. When you complete your Diploma, and can become a technician, the hourly rate could increased to RM10/hour. If you have Degree from your bachelor study, the hourly rate increased to RM15/hour as an Engineer.

Look at it carefully, finishing secondary school and still need to spend another 7 years in tertiary in order to upgrade you skills. The hourly rate is increased form RM4/hour to RM15/hour.

I take the engineering path because this is what i went through from technician to engineer. Of course it apply the same to the accountants, doctors, programmers etc from different level of skill that pay different rate.

Choice 3:
Is there another choice since the formulae only have two factor Time and Hourly rate? Third choice will not be following the same formulae but with different model of making money. Not many people able to comprehend this model well as it was not taught in any conventional school in our society.

In another words, money can be made independenly of TIME. You can make money which not involve your time. Got it?

Back to the Choice 1 and Choice 2 illustrated above, when TIME is spend to make money, we called it ACTIVE income. But for Choice 3, it is the other way and was named as Passive income. You may said that, I knew Passive income but not able to do it. 

So let me explain again, Choice 3 mentioned that we can spend time to learn some skills and work for it now so that in future, it will generate income for us even not using our TIME for it. But there are so few people willing to put in the effort to work this out. They rather to believe Choice 1 and Choice 2 are the ways to do it. 

Passive income is earning money from you past effort. It does not mean that you will earn passive income without working on it. The effort you put in, it will get you return in the future. Thus, your past effort will define you future paycheck.

Conclusion for today writing is we have 3 choices to make money, Choice 3 is the one that not taught in conventional school syllabus. From 35 years old onward, I do understand that whaterver my effort put in, make sure that it will generate income for me in the future. Wish you able to understand the concept now.

Saturday, May 2, 2020

How to value a stock?

We already know that Warren Buffet buy shares when they trade below their fair price.
Similarly to us as Value Investor in the stock market buy at below market value and earn money as they correct up to their real value.
What we have to do is perform Valuation on a stock.
Valuation is all about assessing the intrinsic value of a stock and compare it with the market price in order to understand whether the stock is trading at right price and if you should invest in it.

So million dollar question, how to value a stock?
There are six ways to determine it as below:
  1. Price earning ratio (P/E)
  2. Price to Book ratio (P/B)
  3. Return on Equity (ROE)
  4. Price to Earning to Growth ratio (PEG)
  5. Debt to Equity ratio (Total Debt/shareholder equity)
(1) Price earning ratio (P/E)
Let's start with the simplest ratio first. PE ratio is the most widely used and data is easily available. The P/E ratio is calculated by dividing the price of the stock by the total of its 12-months trailing earnings. Typically companies that are growing rapidly will have higher P/E ratios compared to mature businesses with slower growth rates.
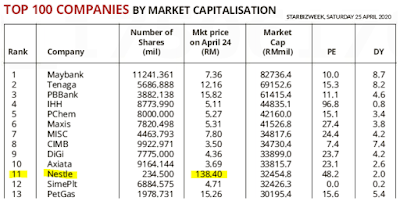
I pulled back the StarBiz publication on 25 April and check on top 15 Bank PE in Malaysia.
Let's take Maybank for this study again, The closing price for the Maybank on 24 April is RM7.36, and the earning as of 31-12-2019 is 72.93 sen per share, PE ratio will be 9.9 times. It means that we have to pay 9.9 in order to earn $1from Maybank.

From the past 5 years historical P/E ratio for Maybank has been 12.
The current P/E ratio is 9.9 times.
If it were trading at its historical P/E ratio of 12, the current stock price should be 12 times $0.7293 equals $8.75.
On this basis, current stock price of Maybank is under value.


(2) Price to Book ratio (P/B)


The price-to-book, or P/B ratio, is calculated by dividing a company's stock price by its book value per share. To determine a company's book value, you'll need to look at its balance sheet, which is defined as its total assets minus any liabilities.

Low P/B ratios can be indicative of undervalued stocks, and can be useful when conducting a thorough analysis of a stock.

Book value is equal to a company's current market value divided by the "book value" of all of its shares. Refer to below 3 steps of defining of the Price to book ratio.
Refer to the Maybank history of its P/B value is about 1.3, current is at 1.03 which is lowest in the last 5 years.

(3) Return on Equity (ROE)
One measure commonly used is return on equity (ROE) which indicates how much profit a company generates from shareholders' equity. P/B ratio and ROE usually correlate well, and any large discrepancy between them may indicate a cause for concern.

ROE is an indicator of how effective management is at using equity financing to fund operations and grow the company. For example a return on 1 means that every dollar of common stockholders’ equity generates 1 dollar of net income.
From Maybank Financial Report, the ROE is range from 10% - 15%. The recent year is sustain at around 10%.

(4) Price to Earning to Growth ratio (PEG)
The PEG ratio formula for a company is as follows:
The PEG ratio is considered to be an indicator of a stock's true value, and similar to the P/E ratio, a lower PEG may indicate that a stock is undervalued.

Let's compare the 3 Top 3 bank in Malaysia. From the table, we see that in term of PE, CIMB is the lowest compare to Maybank and Public Bank. But all the three bank having negative growth in term of the earning. The worst growth is CIMB.
 As for the 3 food companies, in term of PE, Dutch Lady look more attractive than Nestle and F&N. As for the PEG, Dutch Lady also stand out compare to the other two companies. This shows that when we take possible growth into account, Dutch Lady could be the better option because it's actually trading for a discount compared to its value


(5) Debt-to-Equity Ratio
A debt-to-equity ratio is calculated by taking the total liabilities and dividing it by the shareholders' equity:

Debt-to-equity ratio = Liabilities / Equity

It is also a measure of a company's ability to repay its obligations. When examining the health of a company, it is critical to pay attention to the debt/equity ratio. If the ratio is increasing, the company is being financed by creditors rather than from its own financial sources which may be a dangerous trend. Lenders and investors usually prefer low debt-to-equity ratios because their interests are better protected in the event of a business decline. Thus, companies with high debt-to-equity ratios may not be able to attract additional lending capital.

Again look back the 3 bank companies and 3 Food companies on its Debt/Equities ratio:


Developed your own checklist like below:
  • PE below sector average
  • Reasonable PEG 
  • Reasonable PB
  • Low Debt: Equity; 1 to 2 (0.5)
  • ROE of >17%
As a value investor, only buy the stock if the price of the stock goes below the market value of the stock.

Sunday, April 26, 2020

How to look through properly a company Balance Sheet?

What actually a balance sheet is? Balance sheet is one of the financial document that company need to report out to the public. Previous post mentioned about the income statement, and this post will talk about the Balance Sheet.

The purpose of the Balance sheet is to show the condition of its financial health of a business.
When flipping around on a company's annual report, normally I found myself blankly staring at dozens, or even hundreds, of pages of numbers and tables.
I am engineering trained and not used to look at huge numbers and these financial term.

What Is a Balance Sheet?
A balance sheet provides a picture of a company's assets and liabilities, as well as the amount owned by shareholders. These three components have to balanced out and are important information for the investors to understand the business strength.

Let's start to analyze a real business balance sheet again by using yahoo finance. For this case study, will used back the same company during our study on the Income Statement.

Once you have search Nestle within the yahoo finance, click on the Balance Sheet and Annual balance sheet, you will have a sample table like below.

So the first part of the Balance Sheet is the break down of the company Assets. Assets consist of cash, investment, inventory and everything that business owned that can be liquidated into cash when needed. Analogy for us as a personal individual, our asset could be House, car, fixed deposit, shares, unit trust, gold etc can be sell off and get back our cash if we need to do so.

The total current Asset dated 12/30/2019, Nestle asset stand at 1.073 Billion. From google search, the meaning of current assets is simply cash and other assets that are expected to be converted to cash within a year.
As for the Non-current assets means the asset not able to convert into cash within the next 12 months. Warren Buffet called the Goodwill and Intangible as soft asset, because there are not a real asset.

From Investopedia, Goodwill is describe as an intangible asset that is associated with the purchase of one company by another. Specifically, goodwill is the portion of the purchase price that is higher than the sum of the net fair value of all of the assets purchased in the acquisition and the liabilities assumed in the process. The value of a company’s brand name, solid customer base, good customer relations, good employee relations, and proprietary technology represent some examples of goodwill.

Thus, Total non-current assets for Nestle is at 1.653 Billion. Then we sum up the Total Asset and Total non-current assets for Nestle is 2.726 Billion. After looking at the first component of the balance sheet on Asset, now we will move on to the next component which is Liabilities.

In layman term, it just like use we have housing loan, car loan, credit card outstanding etc are called liabilities that we owed to the bank. These are the money we need to pay in the near future. Expectation is all these liabilities to be payoff within next 12 months.
For Nestle, they have Current debt of 0.257 Billion and account payable of 1.133 Billion. Sum up will be 1.654 Billion. Nestle do not have any long term Debt but with Deferred Taxes liabilities under the Non-current Liabilities column.

Add up all the Total Current Liabilities and Non-current Liabilities will be 2.061 Billion
Let's move down to the bottom and will show the Total equities.
Total stockholders' equity of 0.664 Billion comprises of Common stock and Retained earnings (unrealised gain for business). The important number end up will be the Total stockholders' equity.

Total stockholders' equity = Total Asset - Total Liabilities
                                          = 2,726,538 - 2,061,614
                                          = 664,924

So the last row is Total liabilities and stockholders = Total Liabilities + Total stockholders' equity
                                                                                  = 2,061,614 + 664,924
                                                                                  = 2,726,538

After going through the three components in the Balance sheet, how do we know if this is financially stable or good? one way to find out is to find out the ratio of the Total Current Asset over Total current Liabilities.

Total Current Asset / Total current Liabilities =  1,073,013 / 1,654,750 
                                                                         = 0.648 (preferably to be above 1)

It just simply say that, if all the asset requires to dispose off, it will not able to payoff all the debts incurred. Thus, this will put the business in risk.

Second important to take note is the Total Cash and Total Current Asset if they are growing year after year. For instances, Nestle Total Cash is down from  23.996 Billion in 2016 down to just 10.399 Billion in 20192. As for Total Current Assets, it maintain flat 1.030 Billion in 2016 versus 1.073 Billion in 2019

Do the same undertanding and analysis for the Total current liabilities and Total Liabilities.
Form the Balance sheet we can observed that Nestle Total Current Liabilities is increasing over years. But the Current Asset did not increase. If compare the Total Asset Versus Total Liabilities, both are moving in the same direction with similar rate. For my opinion, it is still healthy.

As for the Total stockholders' equity, it looks like it is about flat and not growing much for shareholders.

All above sharing is just purely for educational purposes. Not a recommendation for buy or sell.Do your own due diligent.


Saturday, April 25, 2020

Hwo to analyze Income Statement?

A lot of us find it challenging to read a company's financial statements for until they understand how to interpret them. I assumed that those come from the financial background can easily understand what are those numbers for. But for the rest of people like me is engineer, is hard to understand. Frankly that I am struggling through during my MBA course.

What Is the Purpose of an Income Statement?
The purpose of the income statement is to show you if the company is making profit or loss during a period of time that the business is generating. Income statement also able to show the growth and operating margin of the business. We heard a lot of the top and bottom line in the business world, do you? You are able to find these two number in the income statement.

Some people called the income statement as a profit-and-loss statement, shows total revenues and total expenses over a specific time period.

In fact, you may prepare a simple and basic income statement for yourself. Let me show you in below example:

Here is an example of a basic income statement, covering the period of one month:

Your monthly income either from Sales or Salary (or Gross Income): $3,000
Additional Online sales income                                                          :  $   200
                                                                                   Total Income   :  $3,200

(-minus) Expenses:
House rent                                                                                             :$   400
Dining out                                                                                             :$   600
Petrol                                                                                                     :$   200
Phone Bill                                                                                             :$    160
                                                                                  Total Expenses :   $1,360

Net Income:                                                                                            $ 1,840

If you are able to understand above simple illustration on how will be the income statement like, you will be able to understand the company income statement in the next. Let's pick Nestle as an example to analyze it.

Normally I will be using yahoo finance to search for the company financials. Once you are in the yahoo finance and search for NESTLE, on the tab, click on the Financial and will bring you below statement.
First you need to be aware that the reported number are in thousands ('000). For example, the Revenue showing 5,518,076, it should be read as 5.518 Billion.
Second column on the income statemen show that TTM. TTM stand for Trailing twelve month. On the 12/30/2019 Nestle is generating 5.518 billion Revenue. TTM showing the same as the last quarter report is not out yet. Once the Q1'2020 report is out the TTM number will be different from the 12/30/2019.

So the total revenue generated by Nestle shown here is the Top Line. This is the revenue generated before paying any expenses. The next line is the Cost of Revenue which is the total Manufacturing cost, advertising cost and delivering cost to the customers. After deducting from the Total Revenue, what left is the Gross Profit.

Gross profit = Total Revenue - Cost of Revenue

Gross profit will be used to calculate the Gross Margin.

Gross Margin = Gross profit / Total Revenue x 100%
                       = 2,073,515  /  5,518,076  x 100%
                      = 37.57 %

A such, the Nestle gross margin is 37.57%. Let's move on to check their expenses. Under expenses, there are Selling General and Administrative (SG&A) & Total Operating Expenses. For Nestle, Total Operating Expenses is 1.161 billion, 1.169 billion for SG&A. 

Operating Income = Gross Profit - Total Operating Expenses
                              = 2,073,515 - 911,993
                              =1,161,522

The different of 1.169-1.161 = 0.008 Billion did not report in the yahoo finance. Thus, requires to look into the annual report posted by Nestle in order to find out the details.

Next line is the Operating Income or Loss for the Nestle is 0.911 B. If this line number show negative, then it signified that it was operating at loss.

Once we know the Operating income, we can find out the Operating Margin.

Operating Margin = Operating Income / Total Revenue  x 100%
                              = 1,161,522 / 5,518,076 x 100%
                              = 21 %

Good operating margin should be above 15%. The higher the operating margin, the better it is. For this example, Nestle operating expenses is less than the Gross Profit. Otherwise, it will be at loss. 

Now, let's move down next line, it show that Nestle has to pay Interest of 40.663 Million in last 12 months.
Income Before Tax = Operating Income or Loss - Interest Expense
                                = 911,993 - 40,663
                                = 875,725


After paying Income Tax of 202,812, the Net Income will be 672.913 Billion
This number is the bottom line which is widely used.


After going through the whole income statement here, hope you are able to understand the number well in your study of other company.

Some of the point to take note from the income statement
a) Operating Income or Loss: Must be positive
b) Net income number: Must be positive

Take a look on the history at least 5 to 10 years that enable you able to see the trend. Do not just look at 1 year data to gauge the company performance.